
An impedance spectrum is the most frequently plotted, and most frequently over-interpreted, figure in battery research. A curve starts at a point on the real axis, draws one or two flattened semicircles, then drags into a 45-degree line toward the lower right. Software fits an equivalent circuit and returns R_s, R_SEI, R_ct, C_dl — clean numbers that invite a conclusion. But a fit is a description, not an understanding. The numbers only become evidence when each circuit element is tied to a physical process you can name.

This article works through that assignment process: what the measurement actually probes, which internal process each region of the spectrum responds to, how the spectrum moves as the cell's state changes, and the measurement rules that keep the interpretation from quietly becoming fiction.
What the measurement actually probes
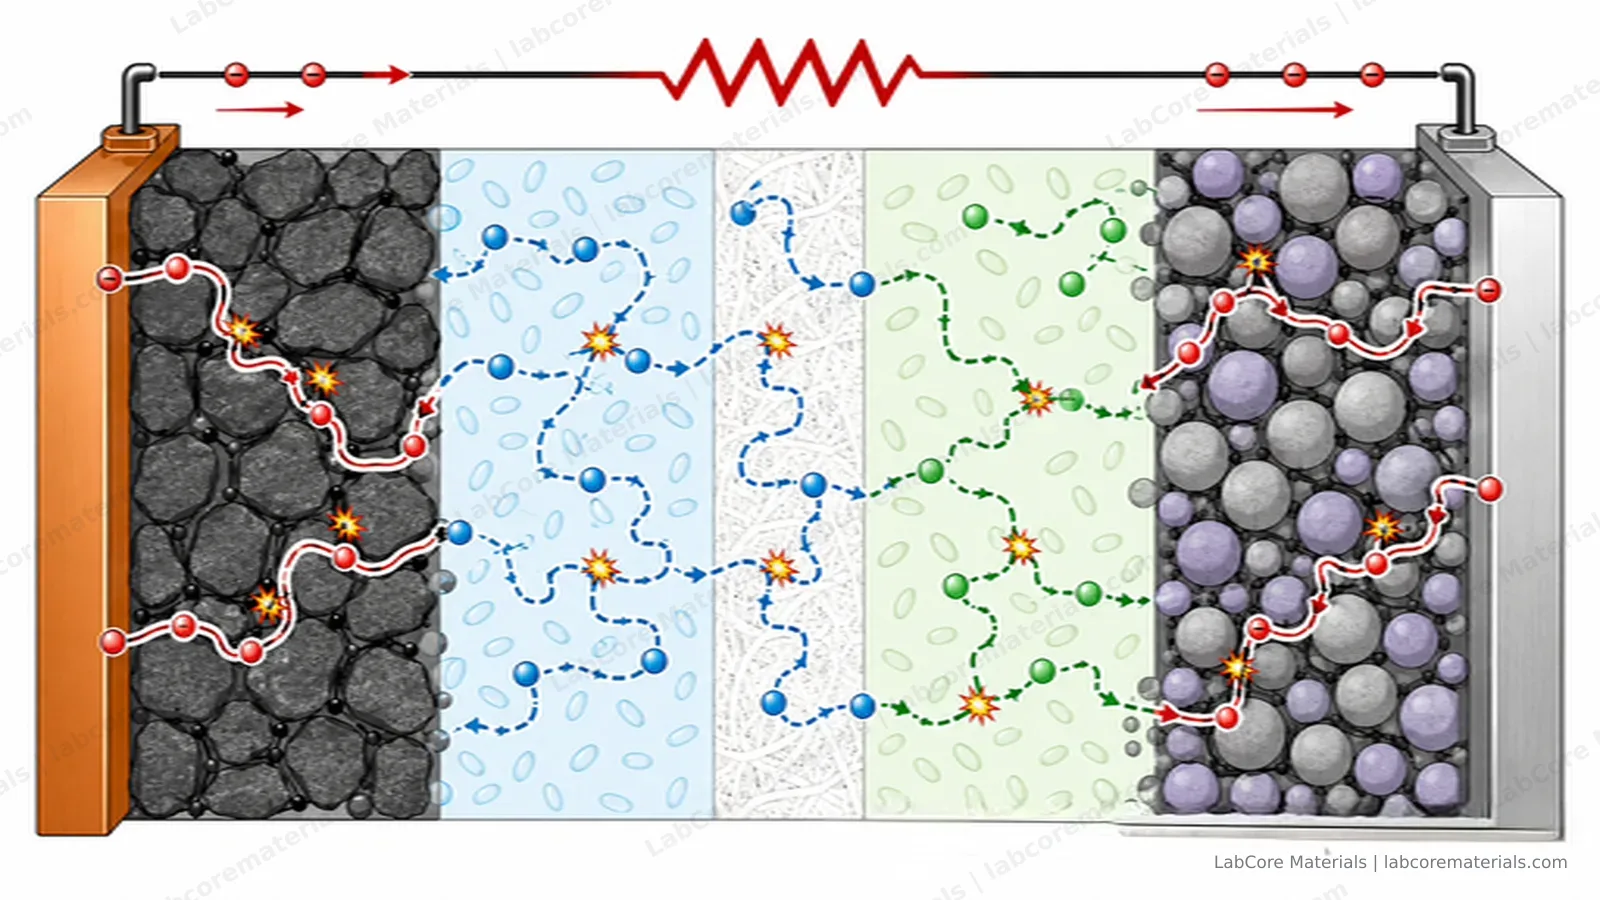
Electrochemical impedance spectroscopy applies a small sinusoidal voltage perturbation — typically 5 to 10 mV — around a held DC potential, and sweeps the frequency from roughly 100 kHz down to 10 mHz. The cell's current response, divided by the perturbation at each frequency, is a complex impedance.
The frequency is the information carrier. A 100 kHz cycle completes in microseconds: only the fastest processes — electron transport through the collectors, ionic conduction through the electrolyte and separator — can keep up. A 10 mHz cycle lasts over a minute: slow processes such as solid-state diffusion now have time to respond. One sweep therefore decomposes the cell's total internal resistance by timescale, which is the entire analytical value of the technique.
Three assumptions hold the interpretation together: the perturbation must be small enough for the response to stay linear, the cell must be at steady state, and the response must be causal. Break any of them and the spectrum still looks plausible — that is what makes the technique deceptively easy to misuse.
Region by region
High-frequency intercept: ohmic resistance. The point where the curve crosses the real axis is R_s — the sum of everything that behaves purely resistively at any relevant frequency: electrolyte ionic resistance, separator contribution, contact and collector resistance. It responds to electrolyte conductivity, separator thickness and stack compression, and to little else.
First semicircle: interphase film. The arc at 100 kHz to a few hundred Hz typically corresponds to lithium-ion transport through and charge transfer across the SEI (or CEI). Its growth during storage and cycling is one of the standard signatures of inventory-consuming side reactions.
Second semicircle: charge transfer. The mid-frequency arc, often the largest, is the kinetic resistance of the actual electrochemical reaction in parallel with the double-layer capacitance. It is strongly SOC-dependent and highly temperature-sensitive — two properties that become diagnostic tools later.
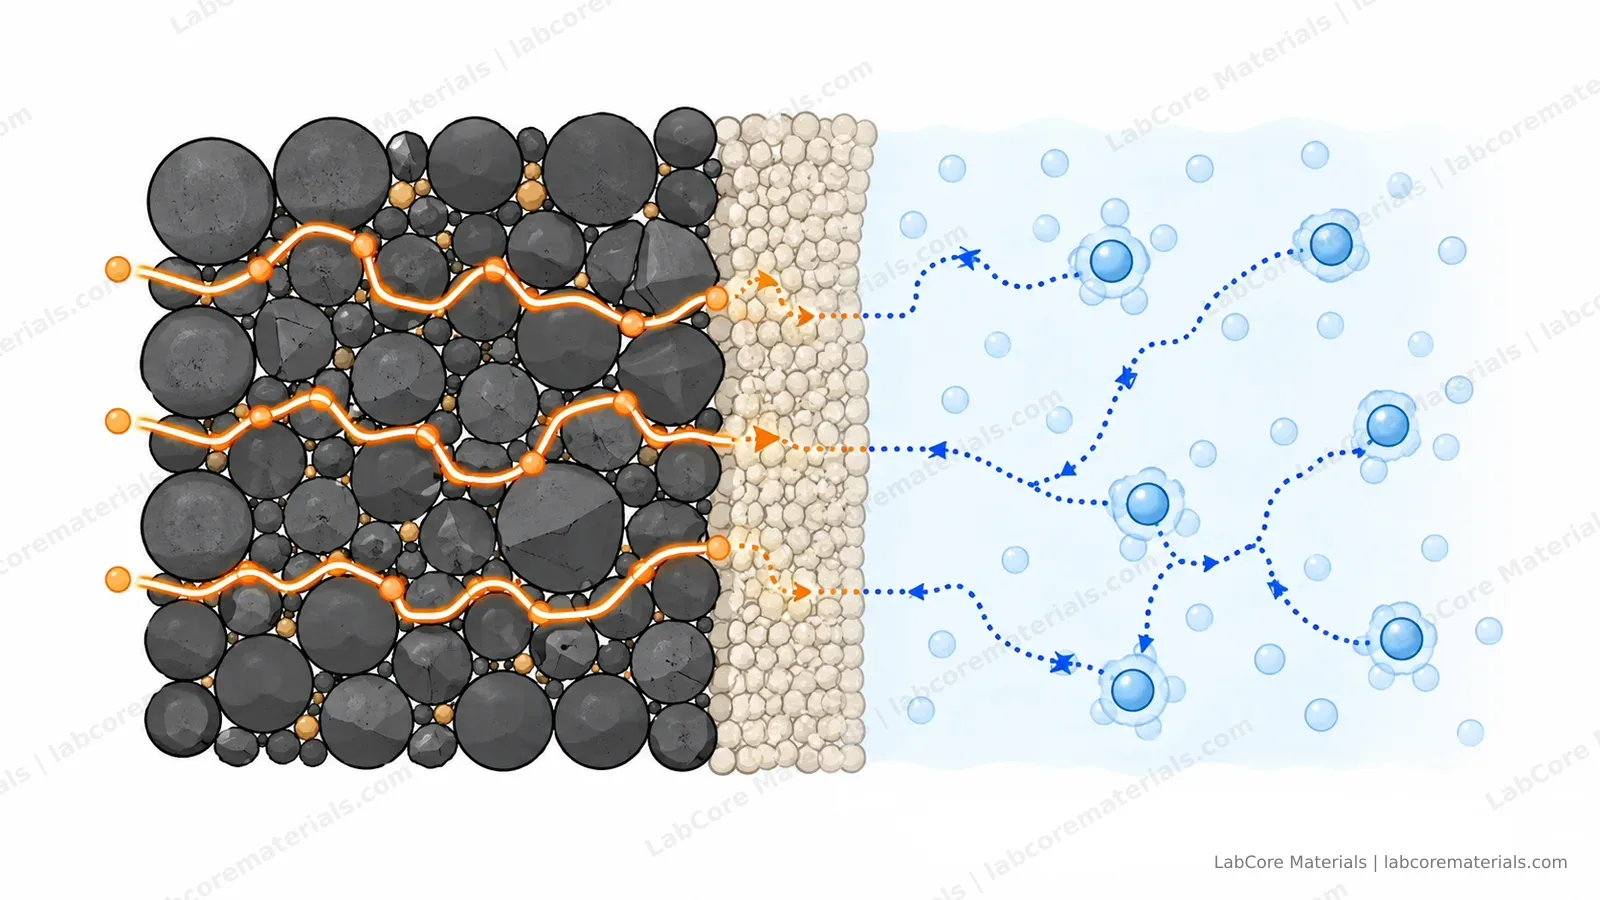
The 45-degree line: Warburg diffusion. At low frequency, semi-infinite solid-state diffusion of lithium produces a line at 45 degrees. Its length is routinely converted into a chemical diffusion coefficient — an estimate that should always be read with the model assumptions attached.
Why the arcs are always depressed: real electrode surfaces are rough, porous and spatially non-uniform, and an ideal capacitor cannot represent them — which is why equivalent circuits use a constant-phase element (CPE) in place of a pure capacitor. How far the CPE exponent departs from 1 is itself a quantification of interfacial heterogeneity; that fitted parameter deserves more attention than it usually gets.
One caution about the equivalent circuit: the fit is not unique. Buteau, Dahn and Dahn (J. Electrochem. Soc., 2018) showed explicitly that different circuit models can be converted into one another mathematically and fit the same data. The fit returns a description; the physical assignment of each element must come from independent evidence — thickness variation, temperature variation, symmetric-cell comparisons — not from the convenience of the model. A model-free aid here is distribution-of-relaxation-times (DRT) analysis: it expands the spectrum over time constants and helps decide how many arcs the model needs — but processes with similar time constants still overlap, and DRT can suggest the number of arcs without performing the physical assignment for you.
How the spectrum moves
The spectrum is a snapshot of a moving target. State of charge reshapes the charge-transfer arc substantially. Aging redistributes resistance among the regions in characteristic ways — which is what made large-scale spectral analysis productive: Buteau and Dahn (J. Electrochem. Soc., 2019) ran a machine-learning inverse model over thousands of measured spectra and tracked how different degradation modes redistribute resistance across the regions.
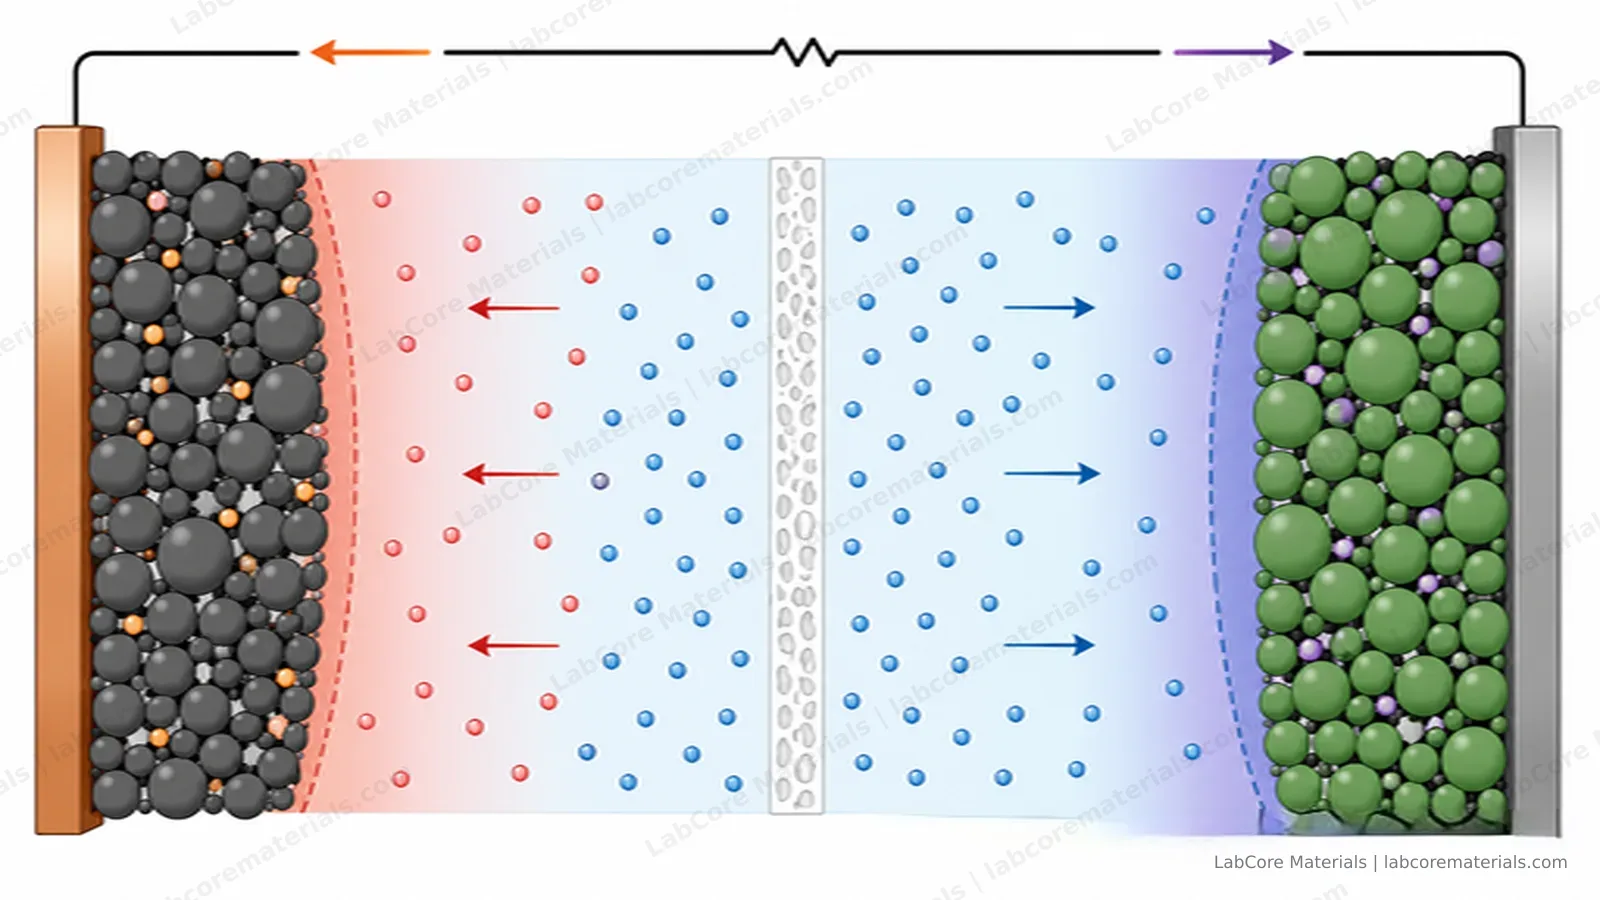
Temperature is the sharpest scalpel. Keefe, Buteau, Hill and Dahn (J. Electrochem. Soc., 2019) measured symmetric cells at several temperatures and separated charge-transfer impedance from contact impedance: the two processes carry different activation energies, so the temperature sweep pulls a mixed spectrum apart into interpretable components. At low frequency, concentration polarization in the electrolyte dominates — the sluggish tail that limits high-rate discharge.
Measurement rules that keep the interpretation honest
- Amplitude discipline: 5–10 mV. Larger perturbations drive the interface out of its linear regime and the spectrum becomes a mixture of physics and artifacts.
- Steady state: measure after the cell has rested at the target SOC, not mid-relaxation; a drifting cell distorts the low-frequency region first.
- Low-frequency skepticism: the last decade of frequency is where noise and drift concentrate. Fitting beyond what the data supports inflates the diffusion estimate.
- Kramers–Kronig validation: checking that the measured spectrum satisfies the KK relations tests linearity and causality without assuming a circuit model — the standard guard against silent artifacts since the method was formalized (Agarwal, Orazem, Garcia-Rubio, 1993).
A practical measurement ladder
Layer 1: full-cell and half-cell spectra. A CR2032 coin cell case kit builds screening cells; for better reproducibility, a two-electrode battery test cell with a titanium body and spring-loaded contact fixes the stack pressure — unstable contact resistance is a leading cause of unreproducible high-frequency intercepts.
Layer 2: separating one electrode. When the question is which electrode changed, a visible three-electrode Swagelok-type test cell with an Ag/AgCl reference electrode resolves the working electrode's impedance from the counter electrode's.
Layer 3: membrane conduction. For ion-exchange membranes, a membrane conductivity test cell — PEEK body, platinum plate electrodes, two-electrode and four-electrode configurations — measures through-plane conductivity directly; the four-terminal version separates the membrane's bulk resistance from the interfacial contributions.
Layer 4: solid electrolytes. In all-solid-state systems both ionic and electronic conductivity are measured with impedance spectroscopy: a pressed pellet of electrolyte powder is clamped between ion-blocking electrodes, the spectrum usually resolves into several arcs — a bulk-conduction arc at the highest frequencies, a grain-boundary arc at mid-to-high frequencies, and an electrode/electrolyte interface arc at mid-to-low frequencies. Without a liquid electrolyte to wet the interface, solid–solid contact impedance is generally higher than in liquid systems and is a principal bottleneck of all-solid-state cells; the grain-boundary arc, in turn, is sensitive to pellet preparation — insufficient densification, grain-boundary impurities or voids all enlarge it, making it a direct gauge of pellet quality. Conductivity is highly sensitive to stack pressure, so the pressurized version of the three-point pressing solid-state battery test mold turns pressure into a recorded experimental parameter; the locking-ring solid-state battery test mold pairs a 4 T stacking force with quick-release disassembly for frequent sample changes inside a glovebox; and when the question is which interface the impedance belongs to, the solid-state three-electrode test mold carries a built-in reference electrode that turns interface diagnostics from inference into direct measurement. Electronic conductivity follows from DC polarization under ion-blocking conditions — the same fixture, two measurements.
| Layer | Question answered | Setup |
|---|---|---|
| Full/half-cell EIS | Total resistance and its distribution | CR2032 kit or two-electrode test cell |
| Three-electrode EIS | Which electrode's impedance changed | Visible three-electrode cell |
| Membrane conductivity | Bulk vs. interfacial resistance of a membrane | Membrane conductivity test cell |
| Solid-electrolyte conductivity | Ionic/electronic conductivity and interface impedance | Solid-state test molds (three-point pressing / locking ring / three-electrode) |
Application cases
| Source | Setup | Observation |
|---|---|---|
| Zhang S, Xu Y, Xie X, Huang X. EES Batteries, 2026, 2: 80–102. DOI: 10.1039/d5eb00153f | Review of EIS measurement, interpretation and application in Li-ion batteries | Systematic treatment of measurement conditions, equivalent-circuit interpretation and EIS applications across cell research |
| Buteau S, Dahn J R. J. Electrochem. Soc., 2019, 166: A1611–A1622. DOI: 10.1149/2.1051908jes | Machine-learning inverse model over thousands of measured EIS spectra of Li-ion cells | Distinguishes degradation modes by how they redistribute impedance across spectral regions |
| Keefe A, Buteau S, Hill I G, Dahn J R. J. Electrochem. Soc., 2019, 166: A3272–A3279. DOI: 10.1149/2.0541914jes | Temperature-dependent EIS on Li-ion symmetric cells | Separates charge-transfer impedance from contact impedance via their distinct activation energies |
| Bruce P G. Solid State Ionics, 1987, 25: 255–262. DOI: 10.1016/0167-2738(87)90189-5 | DC technique for measuring solid-electrolyte conductivity | DC polarization under ion-blocking conditions — the classic route to electronic conductivity |
| Wang J, Bates J B. Solid State Ionics, 1986, 18–19: 224–228. DOI: 10.1016/0167-2738(86)90116-5 | Interfacial impedance model for a solid electrolyte against a blocking metal electrode | Analytical model of solid–solid interface impedance, a theoretical reference for solid-state EIS |
| Buteau S, Dahn D C, Dahn J R. J. Electrochem. Soc., 2018, 165: A228–A234. DOI: 10.1149/2.0841802jes | Equivalent-circuit mathematics for Li-ion EIS | Demonstrates explicit conversion between circuit models — fits are non-unique |
| Agarwal P, Orazem M E, Garcia-Rubio L H. Electrochemical Impedance: Analysis and Interpretation, ASTM STP, 1993: 115–139. DOI: 10.1520/stp18066s | Kramers–Kronig validation of measured spectra | Establishes KK-based consistency testing as the model-free check for linearity and causality |
Conclusion
Impedance spectroscopy decomposes a battery's internal resistance by timescale, from ionic conduction at the highest frequencies through interfacial kinetics to solid-state diffusion at the lowest. Equivalent-circuit fitting is a descriptive step, and the correspondence between circuit elements and physical processes must be established through independent variables — state of charge, temperature, symmetric-cell comparison and Kramers–Kronig validation. Interpreted under these controls, EIS provides a mechanistic basis for studying interfacial evolution, conduction decay and transport limitation in battery electrodes and membranes.