
Two cells that both reach 80% capacity after 500 cycles can look identical on a capacity-versus-cycle plot while failing for entirely different reasons. In one, lithium is being steadily consumed by interfacial side reactions; in another, cathode particles are cracking; in a third, impedance has climbed to several times its initial value; and in a fourth, the cell is essentially healthy — polarization is hiding its true capacity outside the measurement window. Each condition calls for a different fix, some of them mutually contradictory, and a single misdiagnosis sends every subsequent optimization in the wrong direction.

Making sense of the diagnosis starts with bookkeeping. Capacity fade, decomposed, is three kinds of real loss — lithium gone, active material disconnected, impedance grown — plus one convincing illusion.
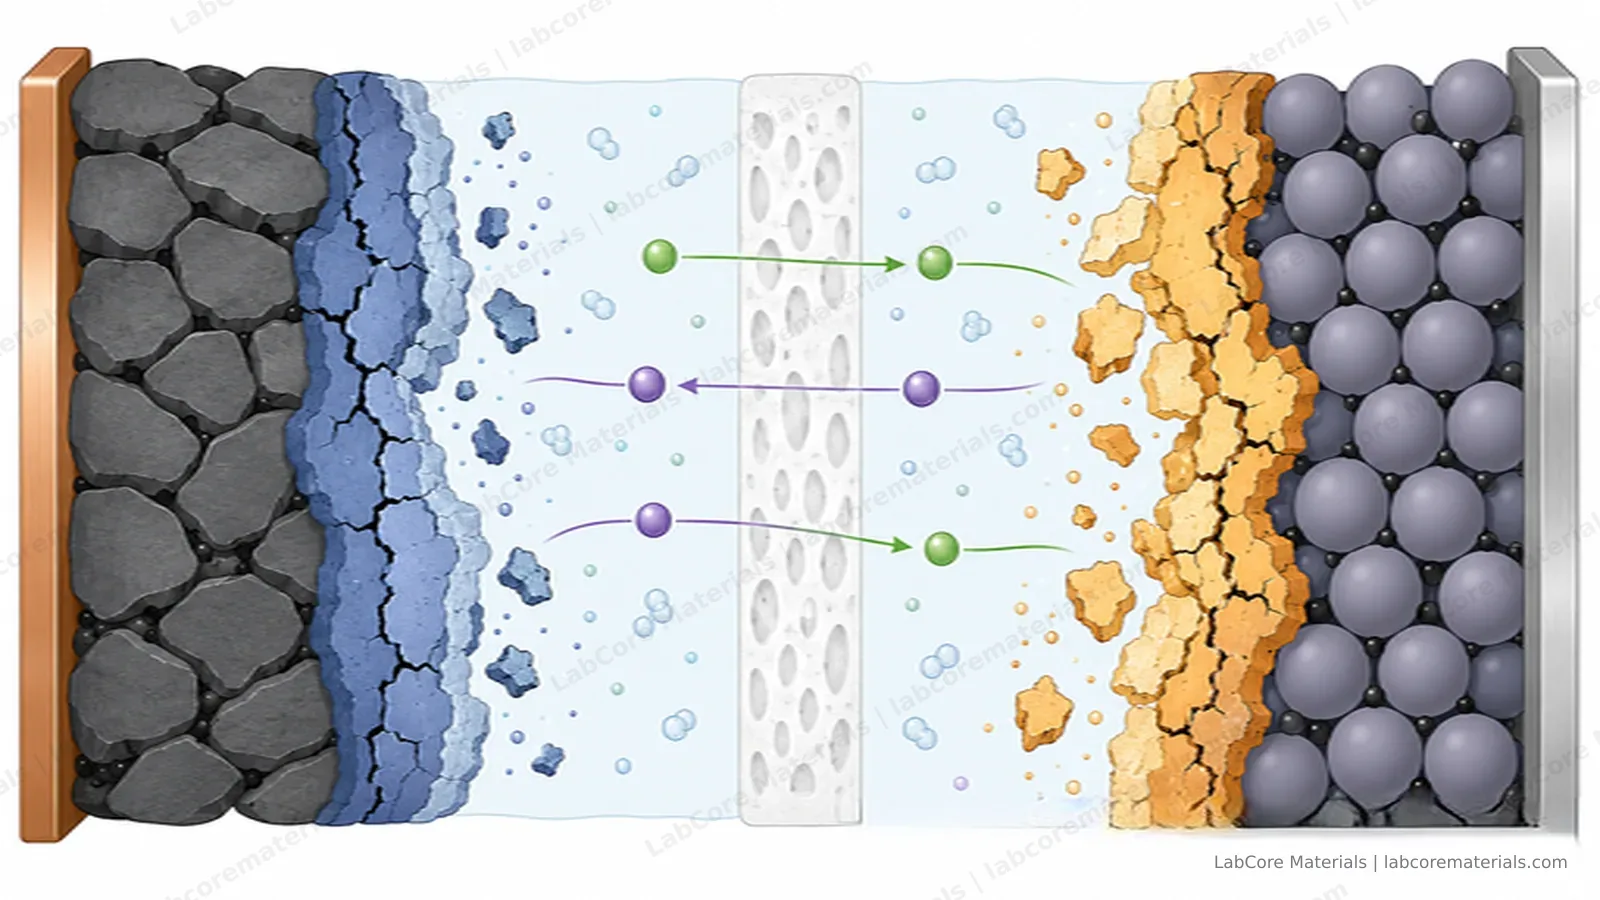
Lithium inventory loss: the SEI and dead lithium
Where does the lithium go? Mostly into the SEI. The electrolyte is thermodynamically unstable against lithiated graphite and metallic lithium; a cell survives hundreds of cycles because of a kinetic bargain struck during formation, when the electrolyte reduces into a film on the anode surface — ion-conducting, electronically insulating — that arrests the reaction. That film is the SEI.
The bargain leaks. Electrons still tunnel slowly through the SEI, the electrolyte keeps getting reduced, and the film keeps thickening; every increment of growth permanently locks away a little more lithium. Graphite cells pay 5–10% of their capacity in the first formation cycle, an expected cost. The trouble is what follows: heat, overcharge, or fast-charge lithium plating crack the SEI repeatedly, and every repair consumes fresh lithium and electrolyte. Lithium that loses electrical contact with the electrode becomes dead lithium — physically present, written off the books.
There is a tidy conversion between Coulombic efficiency and cycle life:
Surviving 500 cycles demands an average CE above 99.8%. Graphite systems manage 99.95% after formation without much trouble; lithium-metal coin half-cells often sit at 98–99%, an order of magnitude short — which is why so many "beautiful for the first 100 cycles" lithium-metal datasets never reach 300.
The cathode: phase transitions, cracking, and the CEI
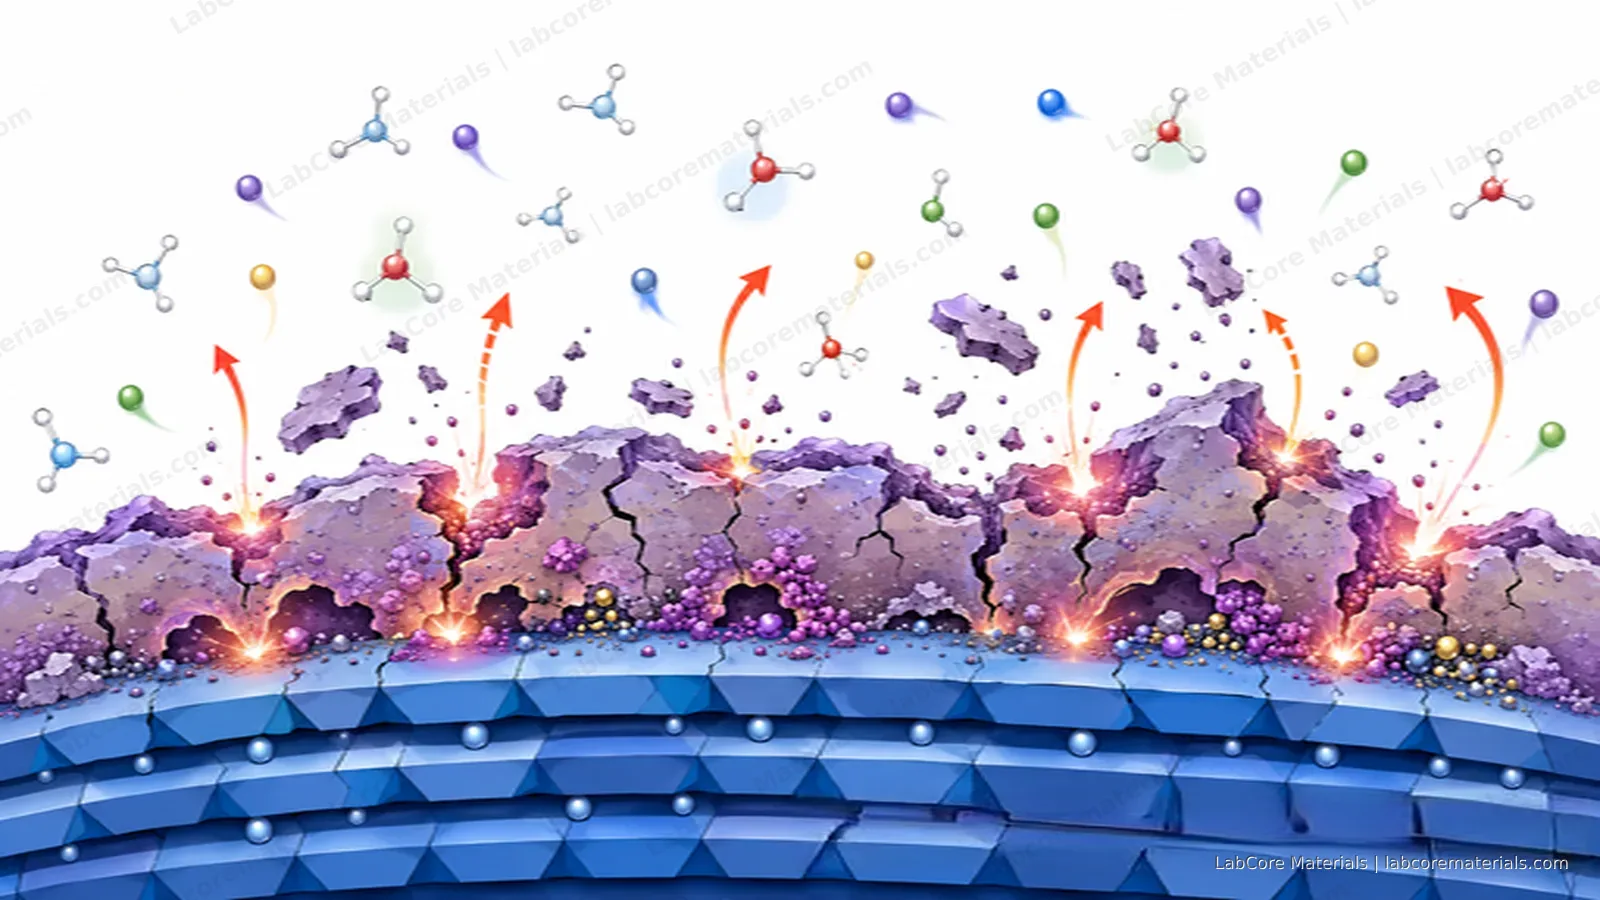
The anode has the SEI; the cathode grows its own counterpart, the CEI, from electrolyte oxidation. But the cathode carries a risk the anode does not: its crystal structure itself deforms. As lithium leaves a layered oxide, lattice parameters shift. LiCoO2 and high-nickel NCM pass through the H1–H2–H3 transition at high state of charge, where the c-axis contracts abruptly. Repeated cycling through that region works the particles like a hinge, and cracks grow between crystallites. Push the voltage further and the lattice starts releasing oxygen, which oxidizes the electrolyte, thickens the CEI, and raises impedance — a self-reinforcing loop.
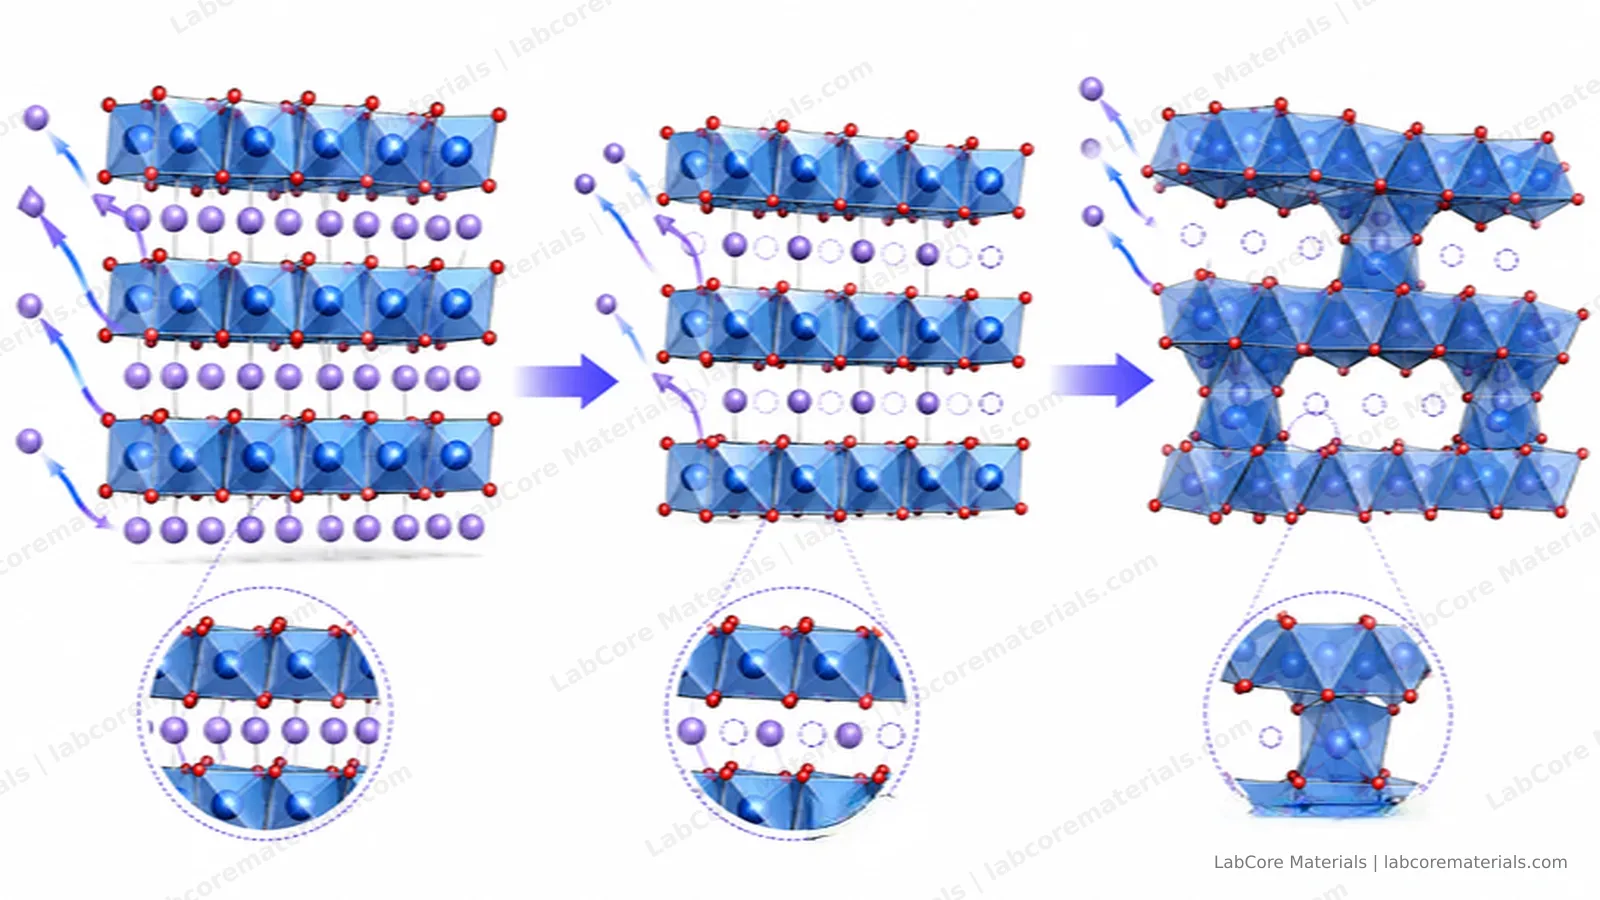
Two consequences are easy to underestimate. First, the charge cutoff voltage is not a free knob: every 0.1 V increase is a bet on how many H1–H2–H3 transitions the chemistry can still tolerate. Second, a degrading cathode exports its problem — dissolved transition metals migrate to the anode and poison its SEI, so cathode failure often shows up wearing an anode's face.
Active material loss: the least reversible
Silicon expands roughly 300% as it alloys with lithium; graphite about 10%. A few hundred breaths later, particles crack, freshly exposed surfaces grow new SEI, and the conductive network can tear. A particle that loses electrical contact is gone from the ledger even though the material itself is chemically intact. This is active material loss, and of the four it is the least reversible.
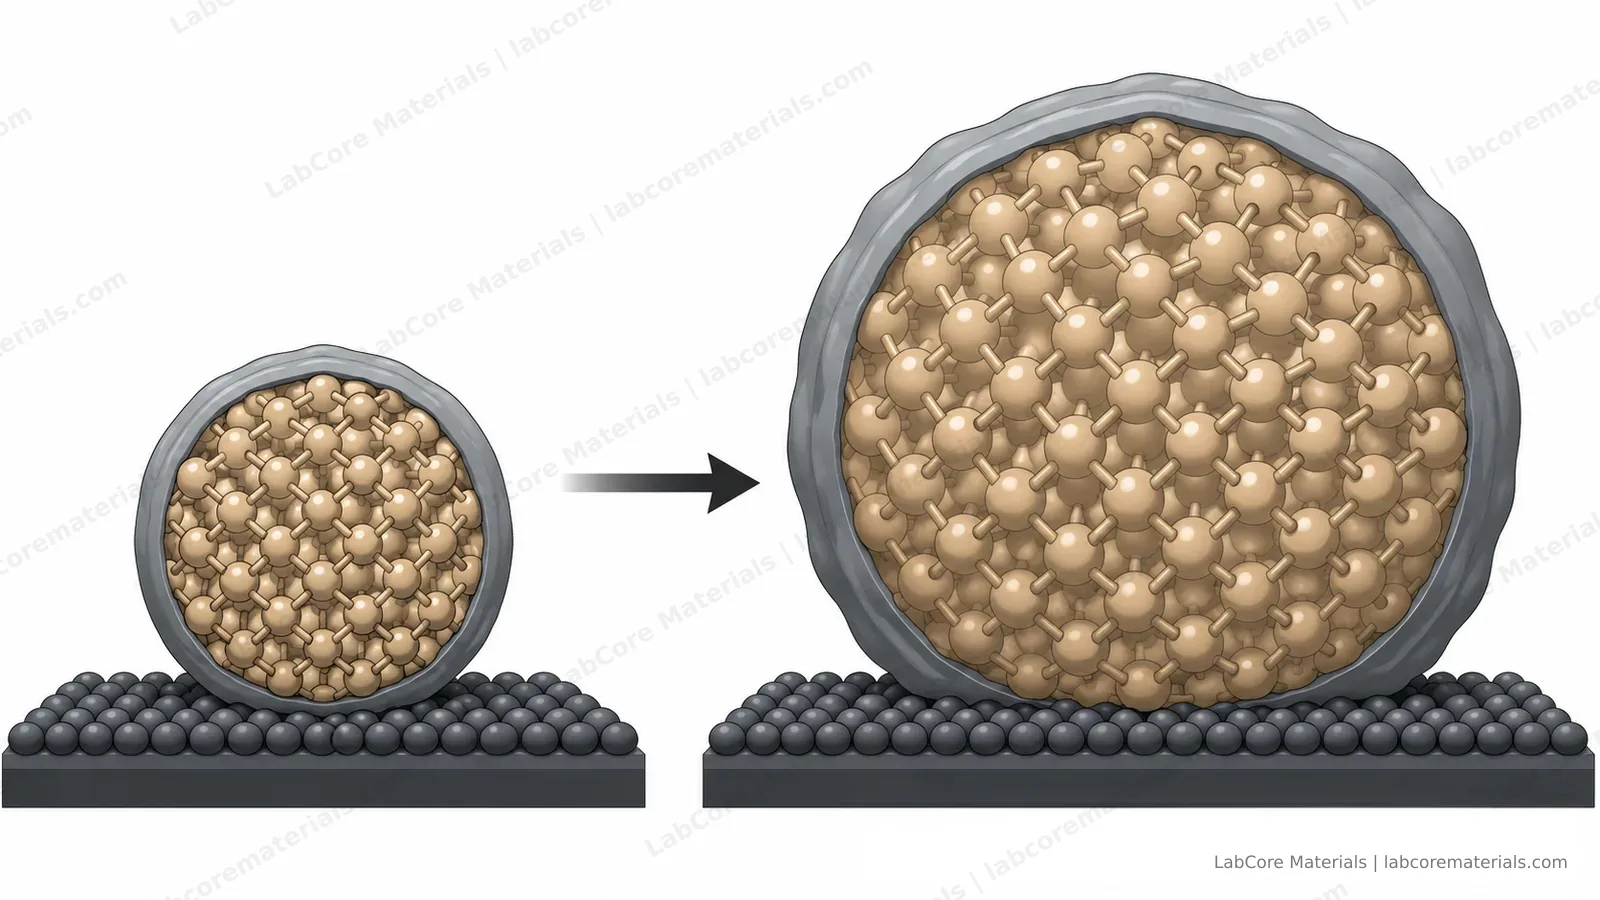
It also explains why electrode engineering matters as much as materials science. Binder choice, conductive additive ratio, calendering density, stacking pressure for silicon — these process parameters decide whether the conductive network and the particles survive a few hundred cycles together.
Polarization: fade that isn't fade
The first three are real losses. The fourth is not a loss at all.
As impedance grows, delivering the same current takes more driving force, and the cell hits the voltage cutoff before discharging fully. The capacity is still in there — temporarily out of reach. The same cell that "loses" 15% at 1C may lose only 5% at C/20; the difference is mostly polarization.
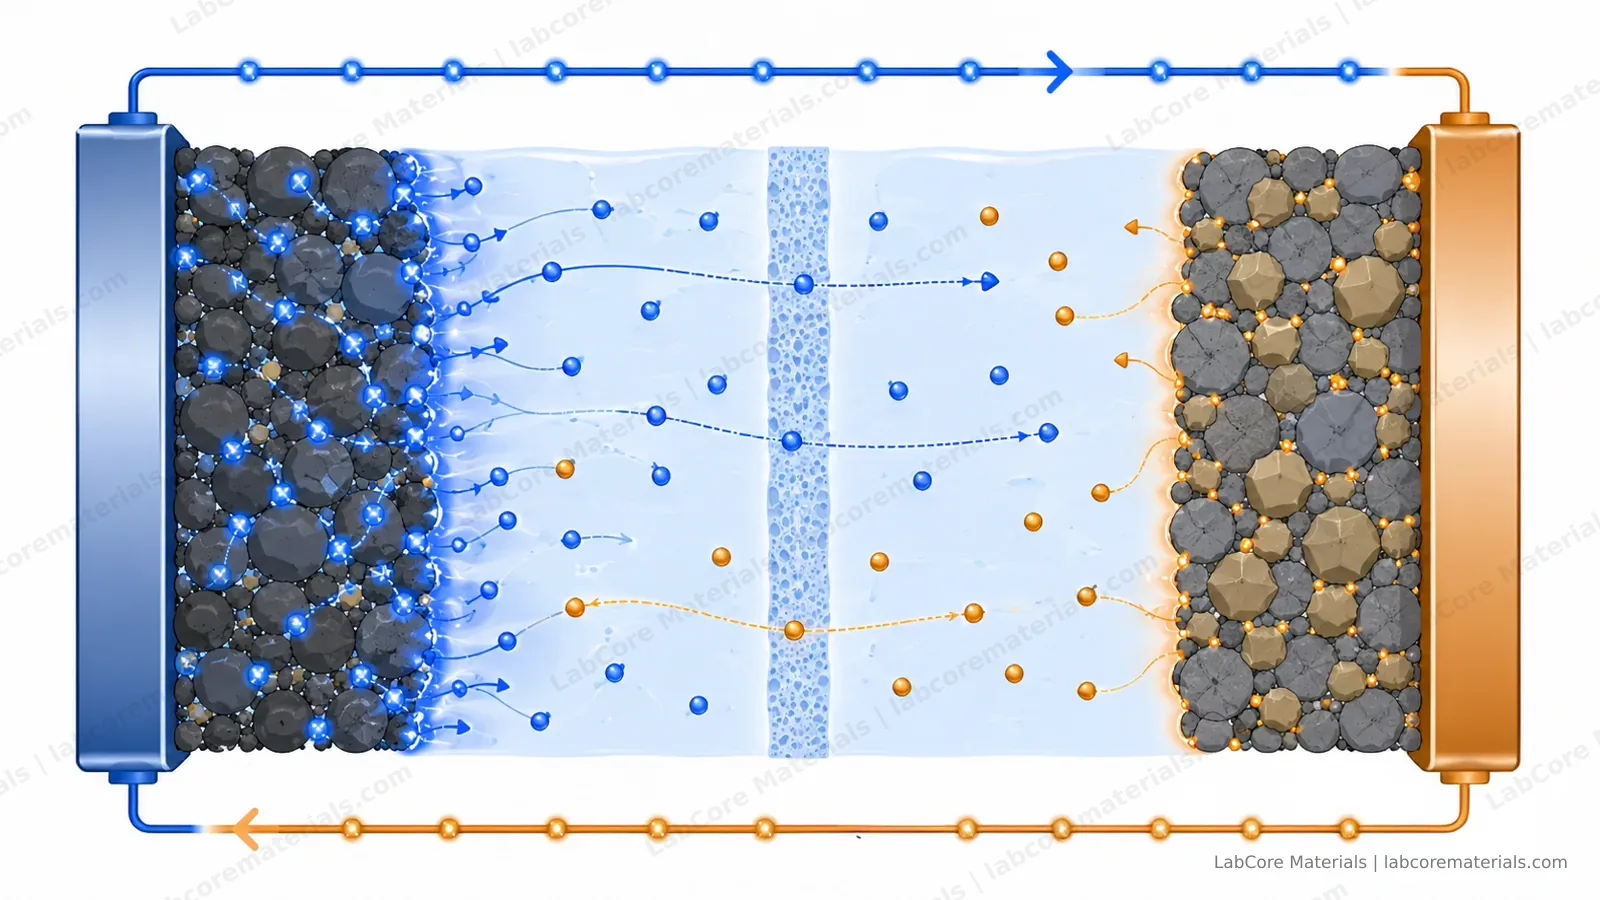
Confusing polarization with real fade produces errors in both directions. Hence the routine of periodic low-rate calibration (C/20 or C/25): the gap between low-rate and high-rate capacity is the current polarization budget, and how fast that gap grows tells you whether impedance deserves attention now.
Verification: make each mechanism confess
That is the theory. The practical question is this: for the fading cell on your bench, how large is each account?
No single measurement answers all of it, but three tools divide the labor:
- dQ/dV analysis. Differential capacity curves respond sharply to the first two accounts: peak positions shifting together point to lithium inventory loss; peak areas shrinking while positions hold point to active material loss.
- EIS. Separating ohmic, interface and charge-transfer contributions and tracking each over cycling shows whether impedance is the dominant term.
- In-situ observation. The first two are indirect evidence; for what actually happens at the interface, the most convincing test is to watch it happen.
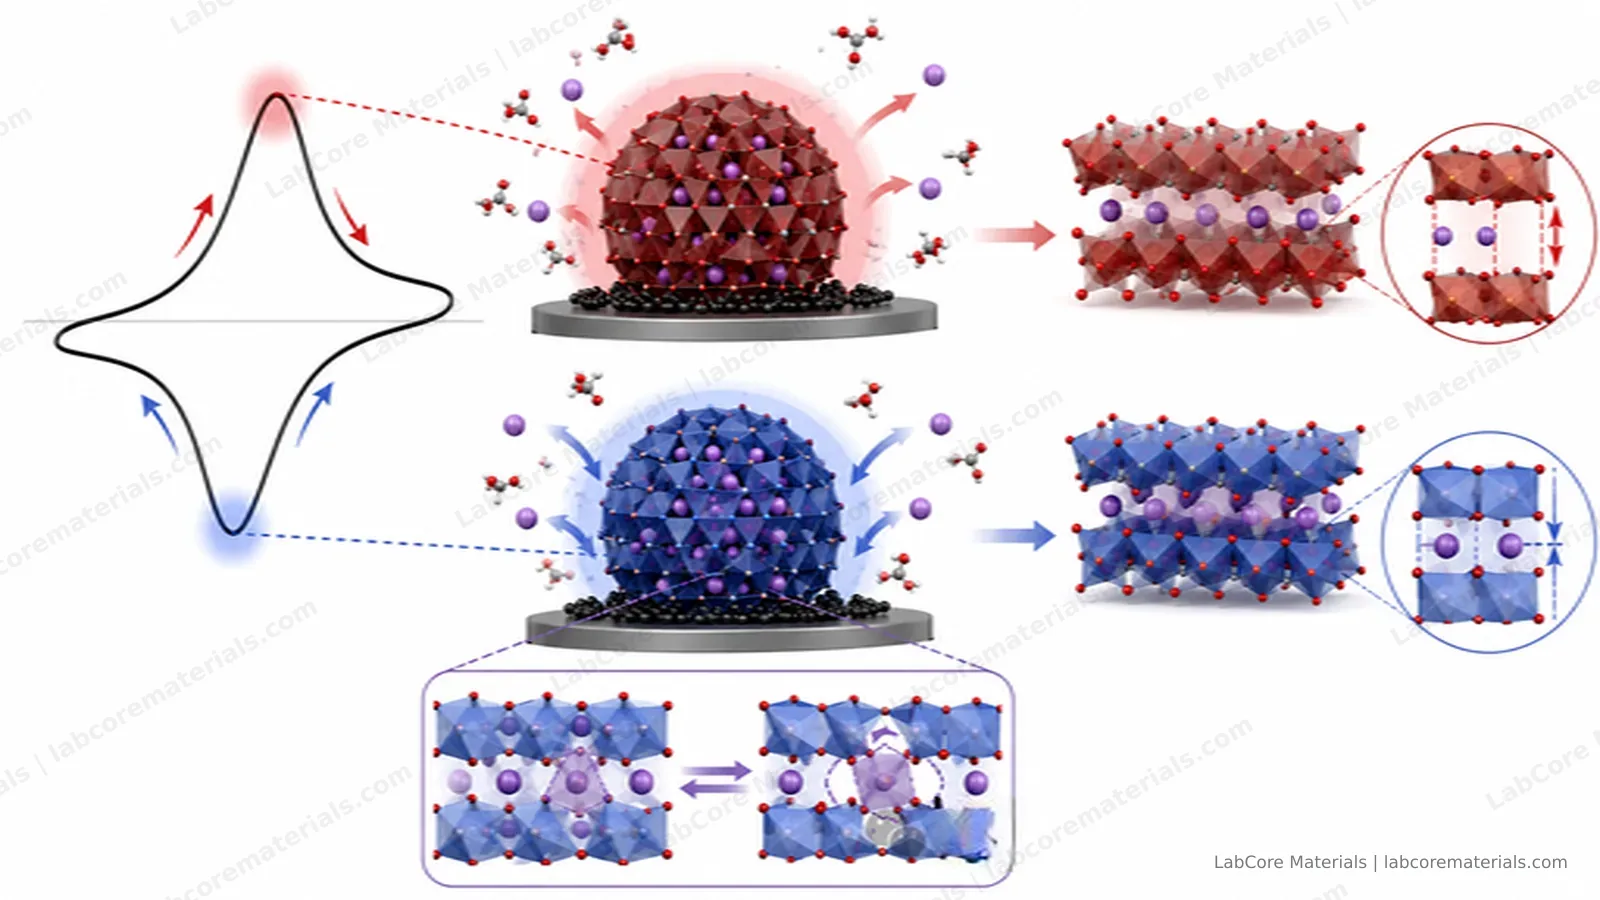
In-situ observation runs on two tracks. For the anode side — whether lithium deposits uniformly or turns mossy, when dendrites first appear — you need an optical window that lets a microscope follow the interface during cycling. Dendrites can be caught optically before they become failures; that is precisely what the in-situ lithium dendrite observation cell is built for: a coin-cell-format optical window in which cycling and imaging never interfere.
For the cathode side — at what voltage the H2–H3 transition actually begins, whether the lattice change is gradual or abrupt — optics are helpless; you need XRD tracking diffraction peaks in real time during charge and discharge. The XRD in-situ cell serves the same philosophy: characterize the cathode's structure while it works, instead of opening the cell afterward and studying the wreckage.
One variable is easy to overlook: if pressure, temperature or contact geometry drift during cycling, every measurement will misattribute the fixture's contribution to the material. The point of in-situ testing is not just visibility — it is holding the cell in a stable, defined state, so the signal belongs to the material alone.
The takeaway
Capacity fade is a ledger. Lithium inventory, active material and impedance are three independent real losses; polarization is a fourth entry that is easy to misread. Every experiment you run writes to all of them at once. Separate the accounts first, then act — choosing the right direction matters more than the work that follows.