
What a Visible Three-Electrode Cell Is For
Once a coin cell case (CR2032, CR2025 and similar) is crimped, the electrode surface is completely hidden. A visible three-electrode cell replaces the crimp with a Swagelok-type body: a sapphire window on one side gives the camera a direct view of the working electrode, and a reference-electrode port on the other side allows the working and counter electrode potentials to be read separately.
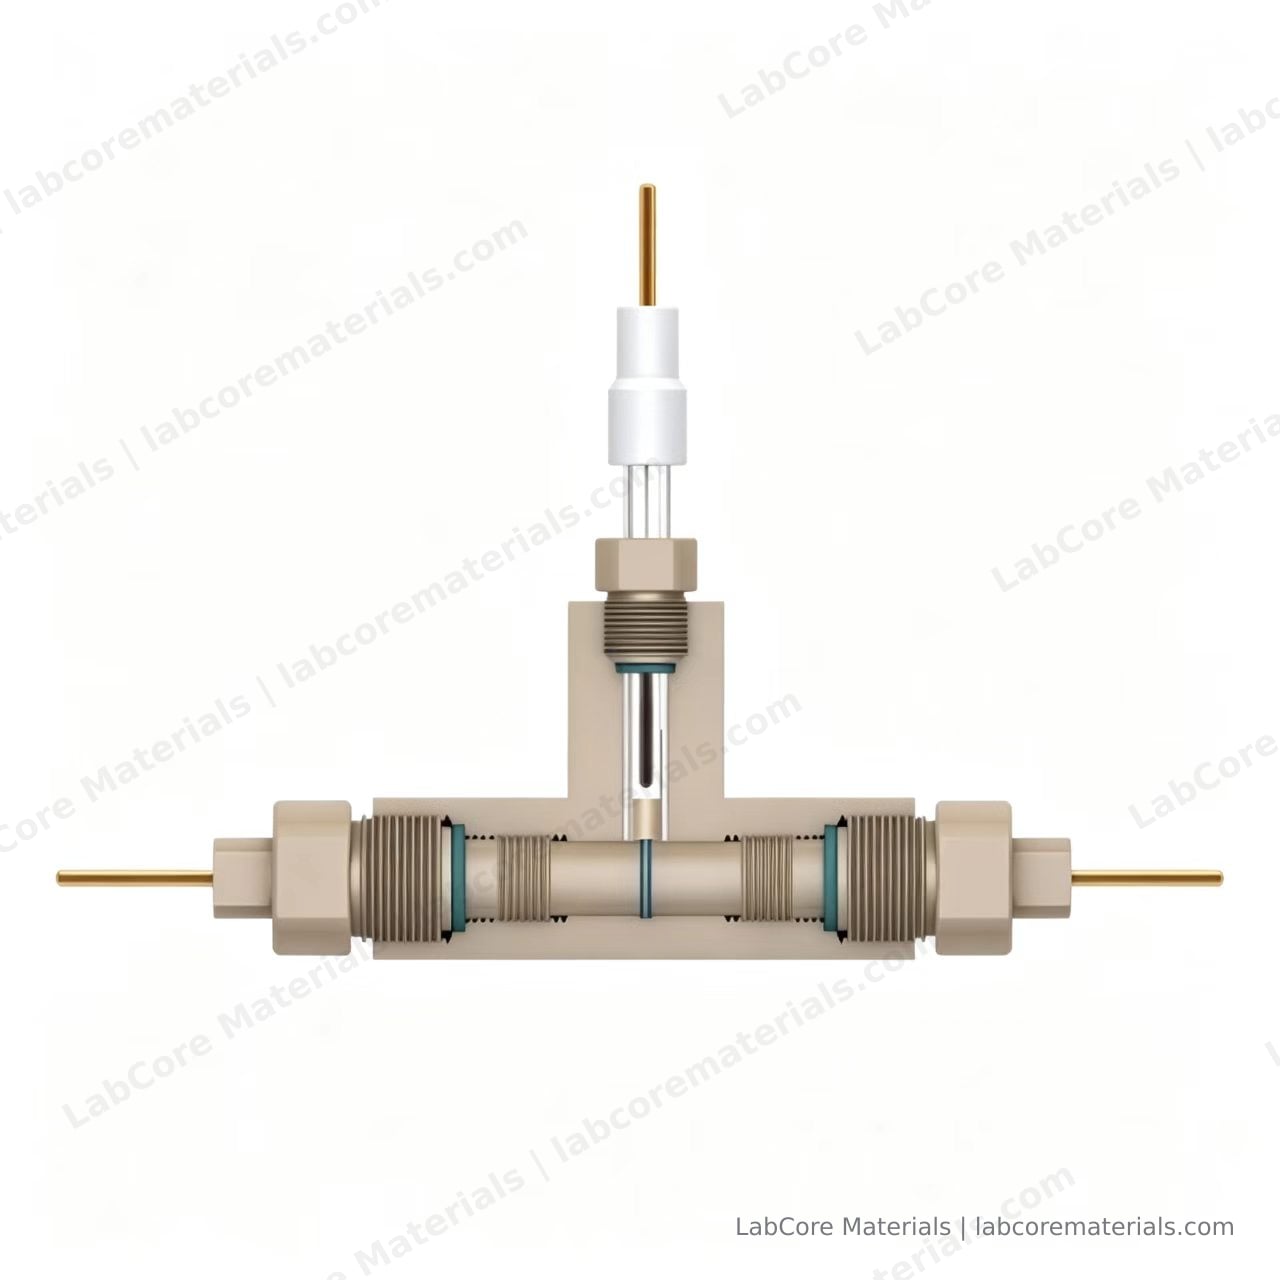
Three kinds of experiment use this hardware:
- Onset criteria for lithium plating: deposit morphology recorded by camera and cross-checked against coulombic efficiency
- Electrolyte wetting and gas evolution: nucleation sites and growth rate of bubbles
- Colour and morphology change of electrode materials: staging colours in graphite lithiation, metal deposition, coating cracking
Compared with a sealed coin cell, the boundary conditions of a visible cell are looser. The cost is a larger electrolyte volume, assembly consistency that depends on the operator, and a pseudo-reference rather than a true reference electrode. These three differences determine how the data has to be processed.
Cell Hardware
| Part | Material and specification | Function |
|---|---|---|
| Body | PEEK | Electrically insulating, electrolyte-resistant, re-openable |
| Window | Single-side sapphire | Transmits visible to near-IR, Mohs 9, resistant to most organic electrolytes |
| Electrodes | Glassy carbon GC-Φ3, two | 0.0707 cm² active area each |
| Reference | Ag/AgCl | Used as a pseudo-reference in organic systems |
| Sample | 10 / 12 / 16 mm | Matched to electrode and separator diameter |
The glassy carbon area is fixed, so current density does not need to be measured each time. When a coated electrode sheet is used instead, record the coated area and active-material loading again; otherwise capacity and rate data are not comparable.
Reference Position Versus Optical Path
The window determines what the camera sees, and the reference determines where the potential is measured. Both occupy the same volume in front of the working electrode, so the position is a choice between two arrangements:
- Angled from the side, tip stopping 1–2 mm outside the upper edge of the working electrode. The reference stays out of frame and the image is unobstructed, which suits observation-led work; the trade-off is a small reference area and higher potential noise at sustained high current.
- Inserted from the side into the space in front of the working electrode, off the optical axis. The potential reading is more stable, which suits impedance-led work; only part of the electrode edge can be imaged.
Hoshi et al. calculated the effect of reference position on impedance spectra by finite element method, and found that changing the distance between the tip and the working electrode introduces a measurable deviation in the mid-frequency range (J. Power Sources, 2015, 288: 168–175). A batch of samples should therefore be measured at one fixed position; once the position changes, impedance data from the two runs cannot be compared directly.
Assembly Sequence
- Clean. Sonicate the PEEK body and electrodes in anhydrous ethanol for 5 min, then dry with nitrogen. Handle the sapphire window separately and never in the same bath as metal parts, to avoid chipped edges.
- Fit the lower electrode. Insert the glassy carbon electrode into the bottom port, push it flush with the body floor, and tighten the retaining nut.
- Place the sample. Centre the electrode sheet, or stack separator, electrode sheet, separator; keep the sample diameter within 1 mm below the cavity diameter to avoid pinched edges.
- Add electrolyte. Dose in two steps: the first wets the sample, the second brings the level slightly above the sample surface. Keep the total below the inner face of the window.
- Fit the counter electrode. Press the upper body into place, keep it coaxial with the lower electrode, and tighten.
- Fit the window. Seat the O-ring, place the sapphire disc, and tighten diagonally in alternating steps so the load is even.
- Insert the reference. Use the position chosen above. Compress the seal just enough; the glass tube cracks easily under lateral force.
- Equilibrate. Leave the assembled cell for 30 min until wetting and open-circuit potential are stable, then start measuring.
The order is not interchangeable. Fitting the window before dosing leaves electrolyte on the inner face, produces a hazy background in every image, and cannot be cleaned without opening the cell.
Measurement Parameters
| Parameter | Suggested value | Note |
|---|---|---|
| Open-circuit rest | 30–60 min | Start once drift is below 1 mV per 10 min |
| CV scan rate | 0.05–0.5 mV/s | Use the low end on the first cycle so frames align with features |
| EIS amplitude | 5–10 mV | Use 5 mV for low-impedance systems to stay in the linear regime |
| EIS frequency | 100 kHz–10 mHz | Extend below 10 mHz for solid-state or high-resistance systems |
| Sampling interval | 1 s or shorter | Must align with image timestamps |
The three-electrode configuration separates the positive and negative electrode potentials. A two-electrode cell gives only the full-cell voltage and cannot show which side degraded first; this is most pronounced in solid-state cells, where a rising interfacial resistance and a rising bulk resistance look alike on the full cell.
Optical Recording
Use a stereo microscope or a long-working-distance objective at 2–10×, with enough working distance to clear the cell body and nuts. Set the camera to manual exposure and fixed white balance, and disable auto gain. Auto gain shifts between frames and removes any meaning from colour or brightness comparison.
Set the frame interval to an integer multiple of the electrochemical sampling interval, for example one frame every 10 s. Timestamp images and current/voltage data on the same computer and register them afterwards by time index rather than by a manually noted start.
Illumination heats the sample. A white LED through a 10× objective can raise the surface temperature by several degrees Celsius, so long cycling runs should use short exposure with interval capture, or reduced intensity while the light is on.
Three Signals Worth Reading in the Images
Plating morphology. Deposits begin as grey-white spots, change to mossy at higher current density, and develop into needles or dendrites. Bai et al. recorded these three morphologies and their dependence on current density and electrolyte chemistry in a comparable visible cell (Energy Environ. Sci., 2016, 9: 3221–3229). The critical current density at which the morphology changes is a more stable metric than a single observation.

Bubbles. Bubbles nucleate between the electrode edge and the window, and the diameter growth rate is approximately proportional to the amount of gas produced, which serves as a check on whether the formation protocol is too aggressive. Distinguish bubbles entrained during dosing, which rise and disappear during equilibration, from gas generated electrochemically.
Colour change. Graphite passes through golden, blue, red and silver-grey staging colours during lithiation, and the colour correlates with state of charge. Manka and Ivers-Tiffée performed electro-optical measurements on graphite anodes and established a quantitative relation between reflectance and lithium content (Electrochim. Acta, 2015, 186: 642–653). Reading state of charge from colour requires the optical path and exposure settings to be held constant for the whole experiment.
Common Faults
| Symptom | Cause | Action |
|---|---|---|
| Electrolyte leak | O-ring under-compressed or misaligned | Replace the O-ring; tighten diagonally in alternating steps |
| Hazy image | Electrolyte or volatiles on the inner window face | Control the dose; inspect with the camera after assembly and re-open if haze appears |
| Reference potential drift | Pseudo-reference unstable in organic electrolyte | Calibrate against ferrocene or lithium foil before and after the run, record the offset, subtract it |
| Bubble trapped in the optical path | Excess electrolyte or entrained air | Tap the body to release the bubble, or reduce the dose |
| Impedance data not comparable | Reference insertion depth changed | Adopt an assembly template, fix the depth and record it |
Scope of This Article
This article covers hardware and procedure. Design criteria for the three-electrode configuration, reference type selection and test sequence are in Three-Electrode System Design; three-electrode testing in solid-state cells and data interpretation are in Three-Electrode Testing for Solid-State Batteries. The physical meaning of each frequency region in an impedance spectrum is covered in How to Read an EIS Spectrum.
References
- Bai P, Li J, Brushett F R, Bazant M Z. Transition of lithium growth mechanisms in liquid electrolytes. Energy & Environmental Science, 2016, 9: 3221–3229. DOI: 10.1039/C6EE01674J
- Manka D, Ivers-Tiffée E. Electro-optical measurements of lithium intercalation/de-intercalation at graphite anode surfaces. Electrochimica Acta, 2015, 186: 642–653. DOI: 10.1016/j.electacta.2015.10.072
- Hoshi Y, Narita Y, Honda K, et al. Optimization of reference electrode position in a three-electrode cell for impedance measurements in lithium-ion rechargeable battery by finite element method. Journal of Power Sources, 2015, 288: 168–175. DOI: 10.1016/j.jpowsour.2015.04.065