
Why Two-Electrode Measurements Are Not Enough
When you cycle a solid-state battery in a standard two-electrode configuration, the voltage you measure is the sum of the working electrode potential and the counter electrode potential, both referenced to each other. If capacity fades after 50 cycles, you see a voltage drop but you cannot tell whether the cathode is degrading, the anode interface is failing, or both.
This ambiguity is why three-electrode systems exist. By inserting a reference electrode with a stable known potential, you can independently monitor the working electrode and counter electrode potentials throughout the experiment. You know which electrode is causing the problem.
For solid-state batteries where interfacial resistance often dominates performance, this distinction is critical. A lithium-metal anode can develop a passivation layer that raises its overpotential by 200 mV while the cathode remains stable. In a two-electrode cell that 200 mV is buried in the total cell voltage. In a three-electrode cell it stands out immediately.
Three-Electrode Cell Architecture
A three-electrode solid-state cell contains:
Working electrode (WE): The electrode under investigation, typically the cathode in a lithium-metal solid-state battery.
Counter electrode (CE): The electrode that completes the circuit, usually a lithium-metal foil in solid-state battery research.
Reference electrode (RE): A third electrode with a stable reproducible potential. For lithium-based systems the reference is also lithium metal, inserted into the solid electrolyte stack where it can sense the local potential without drawing significant current.
The key requirement is that the reference electrode must not participate in the redox reaction. It serves only as a voltage probe. To achieve this, the reference is physically small with low surface area and electrically isolated from the main current path.
Reference Electrode Placement Strategies
In liquid-electrolyte systems you can place the reference electrode anywhere in the electrolyte. Solid electrolytes are different. Ionic current flows along a defined path between WE and CE and the potential distribution is spatially non-uniform if there is significant interfacial resistance.
Strategy 1: Reference Between WE and CE
The reference electrode is sandwiched in the middle of the solid electrolyte stack. This is the most reliable configuration for deconvoluting WE and CE contributions. The reference sits at an intermediate point in the potential gradient and its reading is minimally affected by current distribution artifacts.
Practical challenge: you must ensure that the reference makes good ionic contact with both solid electrolyte layers on either side. For sulfide electrolytes with good malleability this works well under moderate stack pressure 50-200 MPa. For oxide electrolytes like LLZO poor interfacial contact can make the reference potential drift.
Strategy 2: Reference Adjacent to One Electrode
The reference is placed next to the counter electrode. This is easier to assemble and ensures good contact for the reference. The tradeoff: the reference now measures the potential at the CE side of the electrolyte not a true midpoint.
When to use Strategy 2: early-stage experiments where you want to quickly check whether the WE is stable. Also preferred for hard oxide electrolytes where embedding a reference in the middle creates assembly difficulties.
Cyclic Voltammetry Parameter Selection
Scan Rate
Typical range: 0.05-1 mV/s
- 0.05-0.1 mV/s: Slow scan approaching quasi-equilibrium. Use this to identify thermodynamic phase transitions and reversible redox peaks.
- 0.5-1 mV/s: Faster scan emphasizing kinetic limitations. Use this to assess rate capability and identify irreversible side reactions.
For solid-state systems start slow at 0.1 mV/s. Solid-electrolyte ionic conductivity is typically 1-3 orders of magnitude lower than liquid electrolytes so diffusion-limited behavior appears at lower scan rates.
Voltage Window
Set the voltage range based on your cathode materials known operating window plus 0.2-0.5 V margin on each end to detect side reactions. For LiCoO2 use 2.8-4.5 V, for NMC622 use 2.6-4.5 V, for LFP use 2.3-4.0 V.
Number of Cycles
Run 3-5 CV cycles. The first cycle often shows irreversible peaks like SEI formation and trapped lithium while subsequent cycles reveal the stable reversible behavior.
Electrochemical Impedance Spectroscopy Parameter Selection
EIS in a three-electrode cell allows you to separate bulk electrolyte resistance, charge-transfer resistance at the WE, and charge-transfer resistance at the CE. This is something a two-electrode EIS cannot do.
Frequency Range
Typical range: 1 MHz to 10 mHz
- High frequency 100 kHz to 1 MHz: Bulk ionic resistance of the solid electrolyte
- Mid frequency 1 Hz to 10 kHz: Charge-transfer resistance at the electrode interfaces
- Low frequency 10 mHz to 1 Hz: Diffusion Warburg impedance
For solid-state cells with thick electrolytes or low-conductivity materials extend the low-frequency limit to 1 mHz or even 0.1 mHz. Solid-state diffusion is slow and cutting off at 10 mHz will truncate the Warburg region.
AC Amplitude
Typical range: 5-10 mV. Too small below 5 mV causes signal-to-noise ratio degradation. Too large above 20 mV causes non-linear response distortion.
Verify linearity by running the same EIS measurement at 5 mV and 10 mV. If the Nyquist plots overlap the system is linear and your amplitude is safe.
Data Interpretation
In a three-electrode EIS measure Z(WE vs RE) for impedance of the working electrode only. Measure Z(CE vs RE) for impedance of the counter electrode only. Measure Z(WE vs CE) for total cell impedance as validation check.
If the WE semicircle grows significantly after cycling but the CE semicircle remains constant the cathode interface is degrading. If both grow the solid electrolyte is decomposing at both interfaces. If only CE grows the lithium-metal anode is passivating.
Common Experimental Pitfalls
Pitfall 1: Reference Electrode Drawing Current
If the reference electrode has too large a surface area it will draw enough current to polarize and shift its own potential. Solution: Use a small reference electrode 1-2 mm diameter lithium disc is typical. The reference should be at least 10 times smaller in area than the WE or CE.
Pitfall 2: Poor Ionic Contact at the Reference
For sulfide and polymer electrolytes the reference can lose ionic contact if stack pressure is uneven. Solution: Apply uniform stack pressure across the entire cell 100-300 MPa for sulfides. Use a split-cell design with a PEEK or ceramic spacer to ensure even pressure distribution.
Pitfall 3: Lithium-Metal Reference Instability
Lithium metal is the universal reference for lithium-based systems but it is not perfectly stable. It reacts slowly with most solid electrolytes forming a passivation layer. Over long experiments exceeding 100 hours the reference potential can drift by 10-50 mV.
Mitigation strategies: Use fresh lithium foil for the reference and scrape the surface immediately before assembly to remove native oxide. Run a control experiment with a symmetric Li-SE-Li cell to measure the baseline drift rate of your reference under the same conditions.
Pitfall 4: Misinterpreting the True Cathode Potential
The potential you measure at the WE versus RE is the cathode potential including the IR drop through the solid electrolyte between the cathode and the reference. If the solid electrolyte has high resistance this IR drop can be 50-200 mV at practical current densities.
To extract the true interfacial overpotential: Measure the bulk electrolyte resistance from high-frequency intercept in EIS. Calculate the IR drop as V_IR equals I times R_bulk. Subtract the IR drop from the measured WE potential.
Recommended Test Sequence
Day 1 Assembly and stabilization: Assemble the three-electrode cell in a glove box. Apply stack pressure adjusted based on electrolyte type. Let the cell rest for 2-4 hours to allow interfacial equilibration. Measure OCV at all three terminals.
Day 2 Initial characterization: Run EIS at OCV with 1 MHz to 10 mHz frequency range and 10 mV amplitude. Run slow CV at 0.1 mV/s for 3 cycles to map the electrochemical window.
Day 3-7 Galvanostatic cycling: Charge and discharge at C/20 for 5 cycles recording WE and CE potentials continuously. Run EIS at 50 percent SOC after cycles 1, 3, and 5. Check for capacity fade and voltage hysteresis growth.
Day 8 Post-mortem: Disassemble the cell in the glove box. Visually inspect the reference electrode for color change indicating reaction with the electrolyte. Photograph the WE and CE surfaces looking for lithium plating, delamination, or color change.
Suitable Cell Hardware
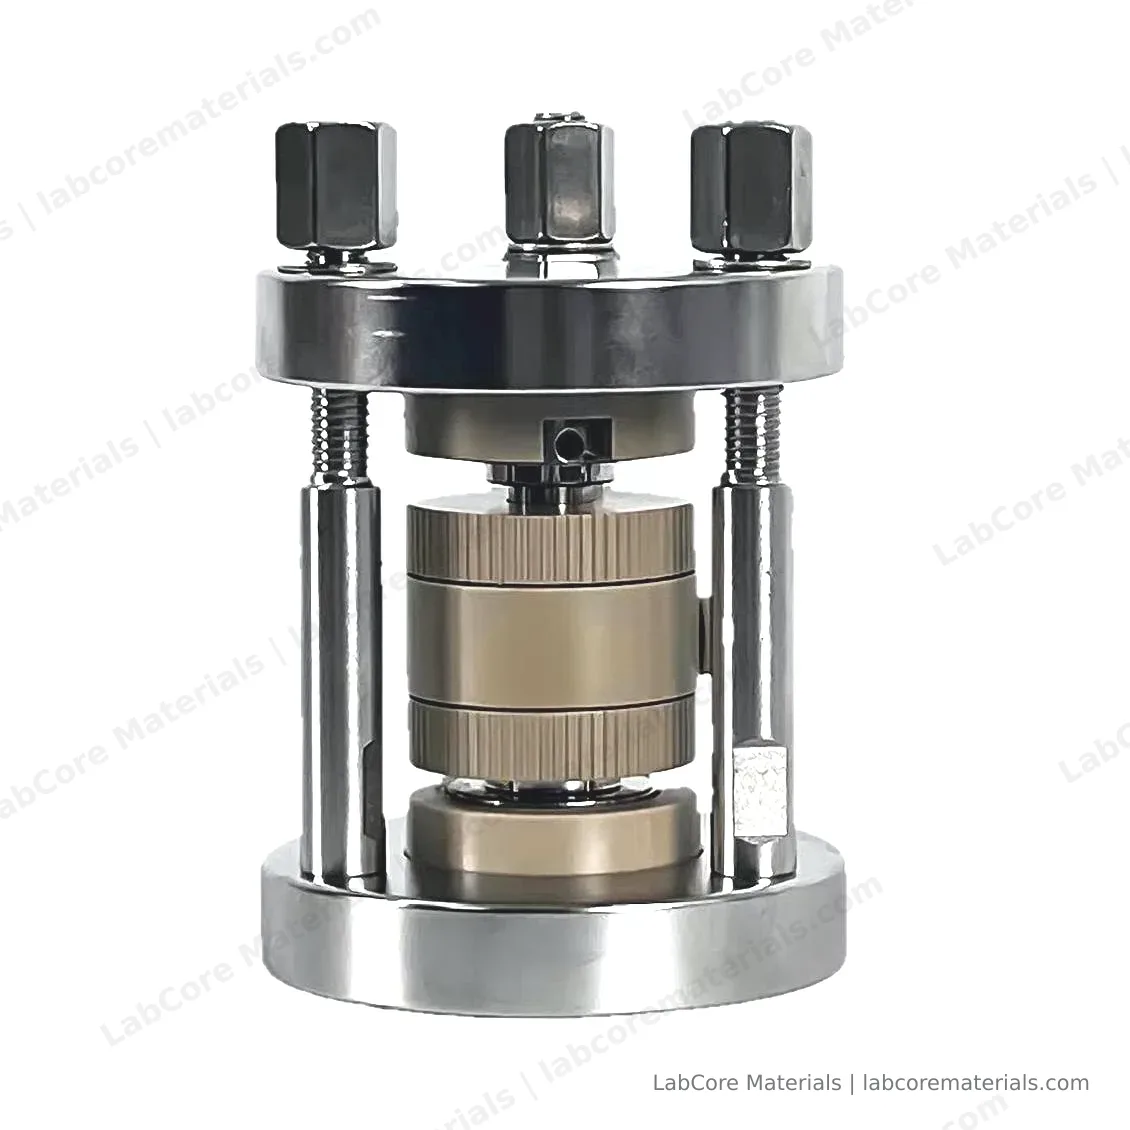
For laboratories working with sulfide or oxide solid electrolytes the split-cell design with integrated reference electrode simplifies assembly and ensures reproducible contact. Key features include PEEK inner core for electrical insulation and chemical resistance up to 200 degrees C. Die-steel plungers maintain uniform stack pressure up to 500 MPa standard or 1000 MPa custom. Compact footprint of 78 mm diameter by 105 mm height fits inside standard glove boxes. Working cavity of 10 mm diameter is customizable from 5-20 mm for lab-scale cathode discs.
The split-cell design allows quick electrode replacement without rebuilding the entire assembly which is critical when screening multiple cathode compositions in parallel.