
If your first in-situ Raman battery experiment returned only window and electrolyte peaks, the cell is the more likely culprit — not the spectrometer.
Three takeaways
- The signal path decides the result. Electrode-to-window distance, window material and cell geometry matter more than spectrometer settings.
- Independent potential control for interfacial processes calls for the three-electrode spectroelectrochemistry cell; real electrode materials followed through cycling call for the two-electrode test cell.
- Start at low laser power and raise it only until the spectrum stops drifting; focus on the electrode surface, not on the window.
Key parameters of the two cells
| Parameter | Spectroelectrochemistry cell (3-electrode) | Two-electrode test cell |
|---|---|---|
| Optical window | 37 mm quartz | Ø8 mm sapphire |
| Electrode-to-window distance | < 6 mm | < 2 mm |
| Electrode format | Plate electrodes, 1 cm² (Au, Pt, glassy carbon, ITO, FTO, carbon paper) | 20 mm electrode sample |
| Potential control | Ag/AgCl or Ag⁺ reference with Pt wire counter | None; coupled to the cycling curve |
| Electrolyte | Flow-through or static fill | Static |
| Body | Quick-release, easy to clean | High-purity titanium, spring-loaded |
| Assembly | Benchtop | Glovebox assembly, benchtop operation afterwards |
Not sure which one fits: spectroelectrochemistry cell | two-electrode test cell
Raman looks like the most convenient in-situ technique in battery research: fast, non-destructive, sensitive to the structural changes of graphite and silicon, and the spectrometer is often already in the building. Yet many first attempts at in-situ Raman battery experiments return spectra of the window and the electrolyte while the electrode stays invisible. The problem is usually not the spectrometer but the cell — the path the signal must travel before reaching the detector decides whether you see the thing you built the experiment for.
This article works from the signal path outward: what Raman can observe in a battery, what that path demands of a cell design, and which questions each of the two cell types is built to answer.
What Raman can see
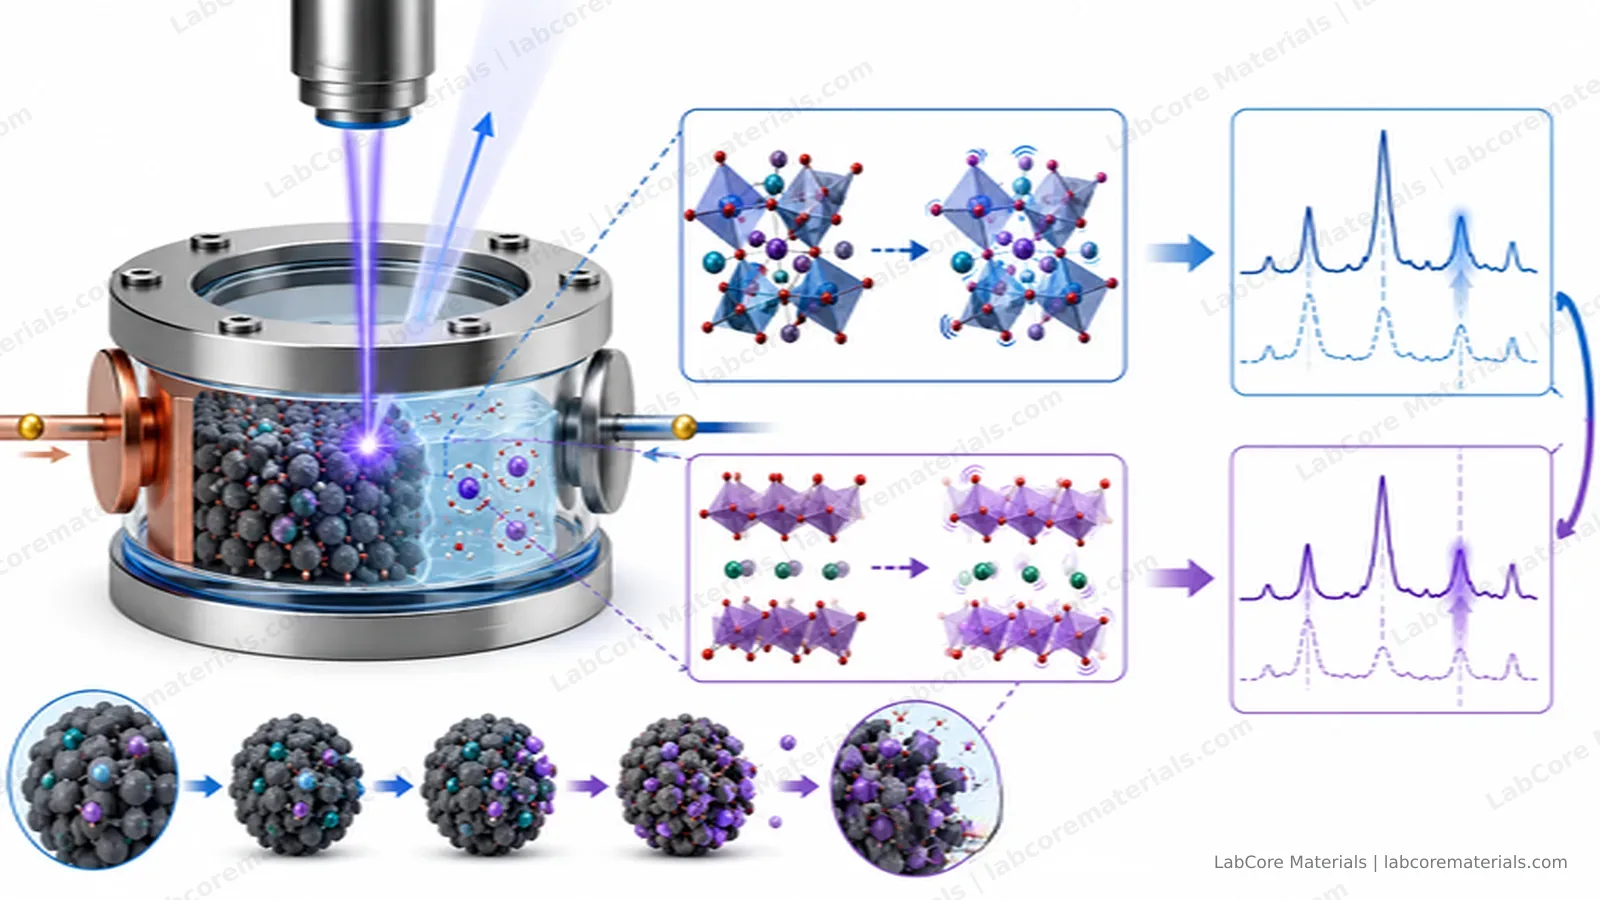
For battery research, Raman's strength is structural evolution. During lithium intercalation the shift and splitting of graphite's G band track the succession of staged compounds (LiC12, LiC6); crystalline silicon's 520 cm⁻¹ peak disappears during first lithiation as the material amorphizes; the D/G ratio of hard carbons evolves with sodium and lithium loading; and some interfacial species and electrolyte components are directly identifiable. Compared with XRD, Raman is more sensitive to amorphous and poorly crystalline phases and fast enough for dense sampling during cycling — exactly the molecular-level events behind the plateaus and kinks of a charge curve.
Its limitations are equally clear. Raman signals are inherently weak, and a battery is a device built to bury its sample: the electrode sits behind an electrolyte layer and a window, and the signal loses intensity along every millimeter of that path. Meanwhile the SEI and the electrolyte generate fluorescence under laser illumination, and the background typically grows with cycling. A good experiment fights both enemies at once.
The signal path decides the cell design
The electrode signal must traverse the electrolyte layer and the optical window before it reaches the objective. Every term along the way has to be compressed:
- Keep the working distance short. Signal intensity falls roughly with increasing electrode-to-window distance; a shorter path raises the electrode's share and reduces absorption by the electrolyte.
- Match the window to the wavelengths. Quartz transmits well across roughly 220–2500 nm, covering common excitation lines; sapphire is harder and can be made thinner, which suits small-diameter, mechanically loaded windows — but each material has its own boundaries at the UV and IR ends.
- Restrain the laser power. Excessive power causes local heating, electrolyte evaporation and even sample damage — the most common artifact introduced by the measurement itself.
These constraints are what separate the two cell types. They are not ranked "better or worse"; each compresses the signal path in the way a particular experiment needs.
Two experimental routes
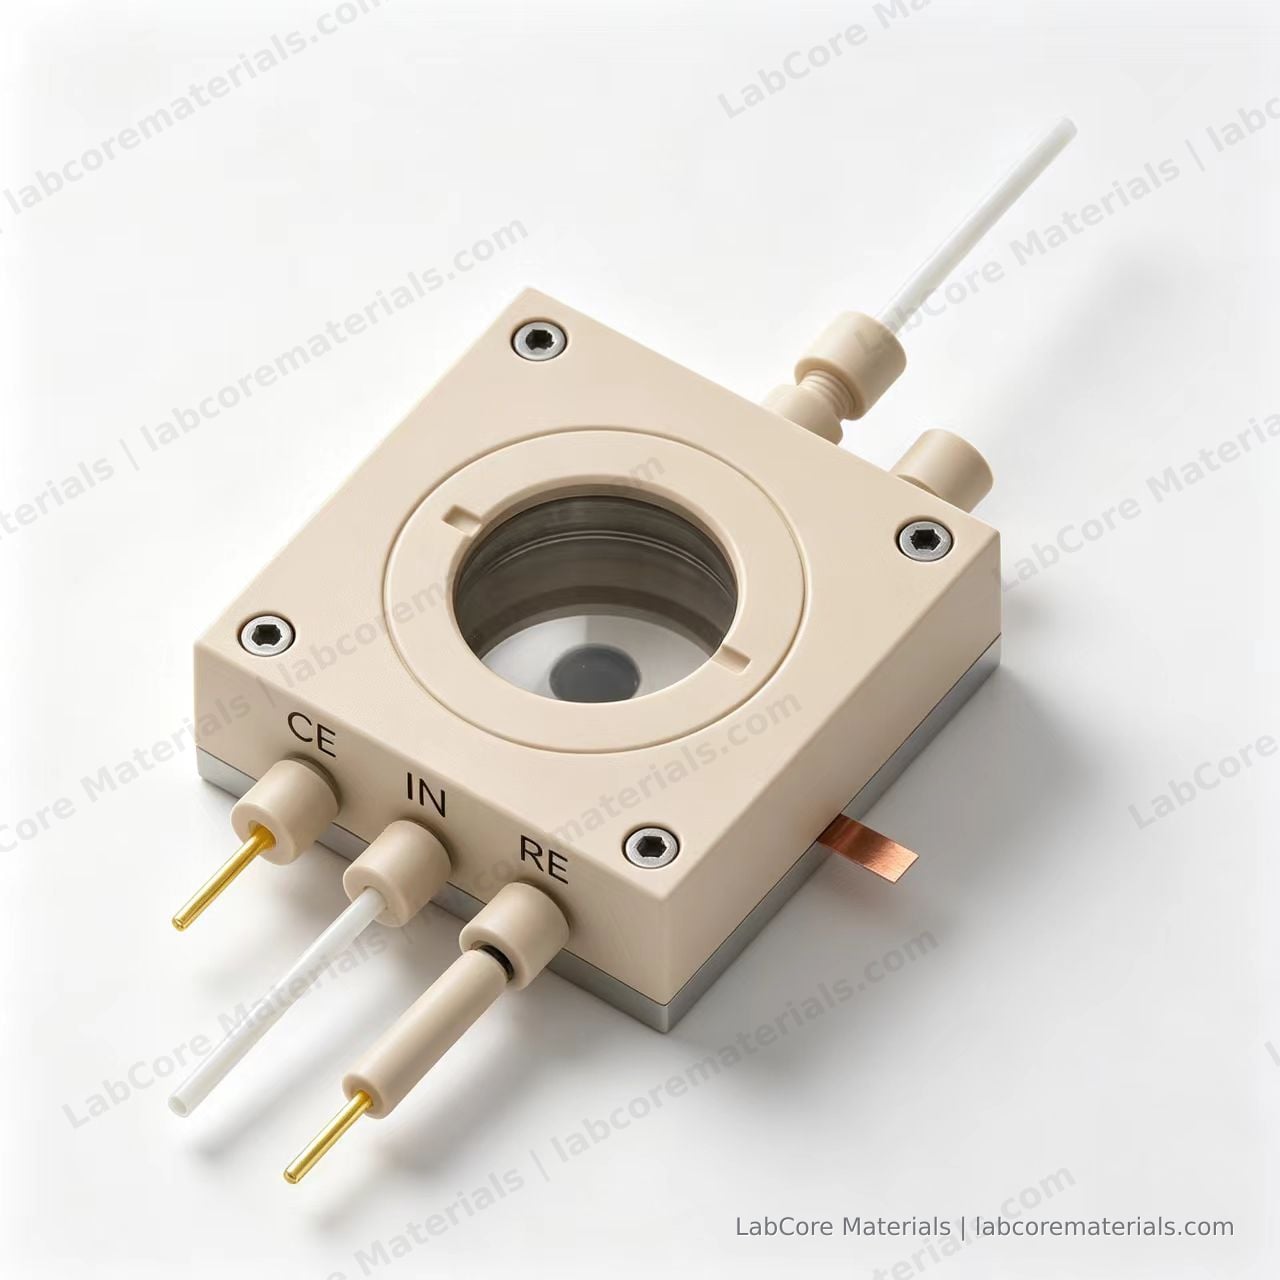
Route one: the spectroelectrochemical cell (three electrodes) — for interfacial processes themselves. If your subject is an interfacial process on a model electrode — catalyst surface reconstruction, phase transitions of insertion materials, ion adsorption at the electrode surface — the in-situ Raman spectroelectrochemistry cell is the right tool: plate working electrodes (Au, Pt, glassy carbon, ITO, FTO, carbon paper; 1 cm²) sit directly beneath a 37 mm quartz window at less than 6 mm distance, an AgCl or Ag⁺ reference and a platinum-wire counter electrode hold the working-electrode potential under independent control, and the cell supports flow operation or static filling with a quick-release structure for cleaning. Three-electrode control means every point in the spectrum corresponds to a known potential — the relation between the interfacial process and the potential can be established directly.
Route two: the two-electrode test cell — for real electrode materials under cycling. If your subject is an actual battery electrode — lithiation of graphite, silicon or composite anodes, SEI formation — the in-situ Raman two-electrode battery test cell compresses the signal path further: a 20 mm electrode sample sits less than 2 mm beneath an Ø8 mm sapphire window, a spring-loaded high-purity titanium body keeps the interface contact stable, and the cell is assembled in a glovebox and operated in open air. What it gives up in potential precision it gains in simultaneity: the spectra and the cycling data come from the same cell over the same time window.
| Question | Electrode form | Potential control | Suitable cell |
|---|---|---|---|
| Interfacial mechanisms (adsorption, reconstruction, insertion kinetics) | Model plate electrodes | Independent, three-electrode | Spectroelectrochemistry cell |
| Lithiation / SEI / phase transitions of real electrodes | Graphite, silicon and other actual electrodes | Two-electrode, coupled with cycling | Two-electrode test cell |
| Flow experiments | Model electrodes | Three-electrode | Spectroelectrochemistry cell (flow-capable) |
Applications
| Source | Setup | Observation |
|---|---|---|
| Krause A, et al. J. Electrochem. Soc., 2019, 166(3): A5378. DOI: 10.1149/2.0541903jes | Silicon nanowire anode in a lithium-ion battery setup; in-situ Raman complemented by X-ray reflectometry and diffraction | A new signal at 1859 cm⁻¹ detected during first lithiation, separating morphology changes from interphase formation |
| Tardif S, et al. ACS Nano, 2017, 11(11): 11306. DOI: 10.1021/acsnano.7b05796 | Operando Raman coupled with synchrotron XRD on silicon nanoparticle anodes | Raman tracked the amorphous phases while XRD tracked the crystalline ones — the two together cover the full lithiation path |
| Cheng X, et al. New Carbon Materials, 2021, 36(1): 93. DOI: 10.1016/S1872-5805(21)60007-0 | Review: in-situ Raman studies of carbon anodes in alkali-metal-ion batteries | A systematic summary of G-band shifts, D/G ratios and staging in graphite and hard carbons during Li/Na intercalation |
Practical notes
Start the laser at low power and increase only until the spectrum stops drifting with time; focus on the electrode surface rather than the window, so the window's own Raman contribution does not survive background subtraction; when fluorescence dominates, first try a longer excitation wavelength instead of raising power or integration time; and keep acquisition parameters identical within a cycling series, so peak positions remain comparable against potential.
Conclusion
In-situ Raman maps the plateaus and kinks of a charge curve onto concrete structural evolution — staging in graphite, amorphization in silicon, the formation of interfacial products — establishing a molecular-level correspondence between process conditions, structural evolution and electrochemical behavior. Two design rules decide whether the spectra can be trusted: compress the signal path so the spectrum reflects the electrode rather than the cell, and restrain the laser so the measurement does not change the object being measured. The spectroelectrochemistry cell provides the three-electrode environment for interfacial processes that need independent potential control; the two-electrode test cell provides the shortest signal path for real electrode materials coupled with cycling data. Choose the cell by the question, and the spectra will point reliably at the mechanism.
Setting up the experiment? Tell us the electrode material, the electrolyte system and the question you need answered — we will suggest a configuration based on the signal path: contact us | spectroelectrochemistry cell | two-electrode test cell